


Census Tract 2101, Weber County, Utah
About
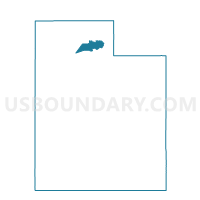
Outline

Summary
| Unique Area Identifier | 498799 |
| Name | Census Tract 2101 |
| County | Weber County |
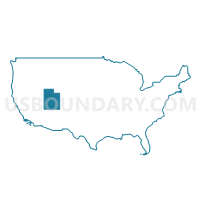
| State | Utah |
| Area (square miles) | 353.43 |
| Land Area (square miles) | 349.27 |
| Water Area (square miles) | 4.16 |
| % of Land Area | 98.82 |
| % of Water Area | 1.18 |
| Latitude of the Internal Point | 41.29454170 |
| Longtitude of the Internal Point | -111.69828930 |
| Total Population | 6,942 |
| Total Housing Units | 4,924 |
| Total Households | 2,330 |
| Median Age | 41.2 |
Maps

Graphs
Select a template below for downloading or customizing gragh for Census Tract 2101, Weber County, Utah


Neighbors
Neighoring Census Tract (by Name) Neighboring Census Tract on the Map
- Census Tract 2001, Weber County, UT
- Census Tract 2002.03, Weber County, UT
- Census Tract 2002.04, Weber County, UT
- Census Tract 2006, Weber County, UT
- Census Tract 2007, Weber County, UT
- Census Tract 2014, Weber County, UT
- Census Tract 2015, Weber County, UT
- Census Tract 2020, Weber County, UT
- Census Tract 2102.01, Weber County, UT
- Census Tract 2102.03, Weber County, UT
- Census Tract 2102.04, Weber County, UT
- Census Tract 2103.03, Weber County, UT
- Census Tract 2112.01, Weber County, UT
- Census Tract 9501, Rich County, UT
- Census Tract 9608.01, Box Elder County, UT
- Census Tract 9701, Morgan County, UT
- Census Tract 9801, Cache County, UT
Top 10 Neighboring County Subdivision (by Population) Neighboring County Subdivision on the Map
- Ogden CCD, Weber County, UT (208,109)
- Brigham City CCD, Box Elder County, UT (26,864)
- Morgan North CCD, Morgan County, UT (8,042)
- Ogden Valley CCD, Weber County, UT (6,604)
- Randolph-Woodruff CCD, Rich County, UT (1,038)
- East Cache CCD, Cache County, UT (105)
Top 10 Neighboring Place (by Population) Neighboring Place on the Map
- Ogden city, UT (82,825)
- North Ogden city, UT (17,357)
- Wolf Creek CDP, UT (1,336)
- Liberty CDP, UT (1,257)
- Huntsville town, UT (608)
- Eden CDP, UT (600)
Top 10 Neighboring Unified School District (by Population) Neighboring Unified School District on the Map
- Weber School District, UT (148,422)
- Ogden School District, UT (82,814)
- Cache School District, UT (64,634)
- Box Elder School District, UT (49,975)
- Morgan School District, UT (9,469)
- Rich School District, UT (2,264)
Top 10 Neighboring State Legislative District Lower Chamber (by Population) Neighboring State Legislative District Lower Chamber on the Map
- State House District 5, UT (43,319)
- State House District 53, UT (37,757)
- State House District 7, UT (35,074)
- State House District 2, UT (34,283)
- State House District 10, UT (33,766)
- State House District 8, UT (32,064)
Top 10 Neighboring State Legislative District Upper Chamber (by Population) Neighboring State Legislative District Upper Chamber on the Map
- State Senate District 17, UT (102,922)
- State Senate District 19, UT (91,855)
- State Senate District 25, UT (89,262)
- State Senate District 18, UT (79,560)
Top 10 Neighboring 111th Congressional District (by Population) Neighboring 111th Congressional District on the Map
Top 10 Neighboring 5-Digit ZIP Code Tabulation Area (by Population) Neighboring 5-Digit ZIP Code Tabulation Area on the Map
- 84404, UT (56,363)
- 84403, UT (36,582)
- 84401, UT (35,622)
- 84414, UT (26,507)
- 84050, UT (9,290)
- 84310, UT (4,111)
- 84317, UT (2,304)
- 84324, UT (701)
- 84018, UT (179)
Data
Demographic, Population, Households, and Housing Units
** Data sources from census 2010 **
Show Data on Map
Download Full List as CSV
Download Quick Sheet as CSV
| Subject | This Area | Weber County | Utah | National |
|---|---|---|---|---|
| POPULATION | ||||
| Total Population Map | 6,942 | 231,236 | 2,763,885 | 308,745,538 |
| POPULATION, HISPANIC OR LATINO ORIGIN | ||||
| Not Hispanic or Latino Map | 6,773 | 192,525 | 2,405,545 | 258,267,944 |
| Hispanic or Latino Map | 169 | 38,711 | 358,340 | 50,477,594 |
| POPULATION, RACE | ||||
| White alone Map | 6,655 | 197,101 | 2,379,560 | 223,553,265 |
| Black or African American alone Map | 34 | 3,136 | 29,287 | 38,929,319 |
| American Indian and Alaska Native alone Map | 34 | 1,902 | 32,927 | 2,932,248 |
| Asian alone Map | 42 | 2,911 | 55,285 | 14,674,252 |
| Native Hawaiian and Other Pacific Islander alone Map | 7 | 614 | 24,554 | 540,013 |
| Some Other Race alone Map | 35 | 18,680 | 166,754 | 19,107,368 |
| Two or More Races Map | 135 | 6,892 | 75,518 | 9,009,073 |
| POPULATION, SEX | ||||
| Male Map | 3,567 | 116,075 | 1,388,317 | 151,781,326 |
| Female Map | 3,375 | 115,161 | 1,375,568 | 156,964,212 |
| POPULATION, AGE (18 YEARS) | ||||
| 18 years and over Map | 4,983 | 161,925 | 1,892,858 | 234,564,071 |
| Under 18 years | 1,959 | 69,311 | 871,027 | 74,181,467 |
| POPULATION, AGE | ||||
| Under 5 years | 371 | 20,837 | 263,924 | 20,201,362 |
| 5 to 9 years | 553 | 19,667 | 249,572 | 20,348,657 |
| 10 to 14 years | 643 | 18,378 | 227,951 | 20,677,194 |
| 15 to 17 years | 392 | 10,429 | 129,580 | 12,954,254 |
| 18 and 19 years | 195 | 6,832 | 91,510 | 9,086,089 |
| 20 years | 59 | 3,436 | 42,204 | 4,519,129 |
| 21 years | 78 | 3,481 | 45,173 | 4,354,294 |
| 22 to 24 years | 179 | 10,719 | 139,142 | 12,712,576 |
| 25 to 29 years | 232 | 19,131 | 229,554 | 21,101,849 |
| 30 to 34 years | 312 | 17,469 | 216,133 | 19,962,099 |
| 35 to 39 years | 348 | 14,559 | 178,401 | 20,179,642 |
| 40 to 44 years | 448 | 12,899 | 154,074 | 20,890,964 |
| 45 to 49 years | 581 | 14,160 | 154,831 | 22,708,591 |
| 50 to 54 years | 701 | 14,123 | 152,133 | 22,298,125 |
| 55 to 59 years | 588 | 11,904 | 133,122 | 19,664,805 |
| 60 and 61 years | 196 | 4,174 | 46,154 | 7,113,727 |
| 62 to 64 years | 263 | 5,650 | 60,965 | 9,704,197 |
| 65 and 66 years | 129 | 3,088 | 34,485 | 5,319,902 |
| 67 to 69 years | 174 | 3,901 | 44,995 | 7,115,361 |
| 70 to 74 years | 220 | 5,275 | 58,744 | 9,278,166 |
| 75 to 79 years | 144 | 4,440 | 45,835 | 7,317,795 |
| 80 to 84 years | 77 | 3,437 | 34,412 | 5,743,327 |
| 85 years and over | 59 | 3,247 | 30,991 | 5,493,433 |
| MEDIAN AGE BY SEX | ||||
| Both sexes Map | 41.20 | 30.70 | 29.20 | 37.20 |
| Male Map | 41.60 | 30.20 | 28.70 | 35.80 |
| Female Map | 40.90 | 31.40 | 29.70 | 38.50 |
| HOUSEHOLDS | ||||
| Total Households Map | 2,330 | 78,748 | 877,692 | 116,716,292 |
| HOUSEHOLDS, HOUSEHOLD TYPE | ||||
| Family households: Map | 1,905 | 57,867 | 660,234 | 77,538,296 |
| Husband-wife family Map | 1,704 | 44,621 | 535,827 | 56,510,377 |
| Other family: Map | 201 | 13,246 | 124,407 | 21,027,919 |
| Male householder, no wife present Map | 81 | 4,183 | 38,858 | 5,777,570 |
| Female householder, no husband present Map | 120 | 9,063 | 85,549 | 15,250,349 |
| Nonfamily households: Map | 425 | 20,881 | 217,458 | 39,177,996 |
| Householder living alone Map | 345 | 16,867 | 164,018 | 31,204,909 |
| Householder not living alone Map | 80 | 4,014 | 53,440 | 7,973,087 |
| HOUSEHOLDS, HISPANIC OR LATINO ORIGIN OF HOUSEHOLDER | ||||
| Not Hispanic or Latino householder: Map | 2,287 | 69,148 | 793,895 | 103,254,926 |
| Hispanic or Latino householder: Map | 43 | 9,600 | 83,797 | 13,461,366 |
| HOUSEHOLDS, RACE OF HOUSEHOLDER | ||||
| Householder who is White alone | 2,273 | 69,771 | 785,761 | 89,754,352 |
| Householder who is Black or African American alone | 2 | 1,090 | 8,252 | 14,129,983 |
| Householder who is American Indian and Alaska Native alone | 9 | 617 | 9,152 | 939,707 |
| Householder who is Asian alone | 10 | 959 | 16,474 | 4,632,164 |
| Householder who is Native Hawaiian and Other Pacific Islander alone | 3 | 152 | 5,253 | 143,932 |
| Householder who is Some Other Race alone | 12 | 4,790 | 39,501 | 4,916,427 |
| Householder who is Two or More Races | 21 | 1,369 | 13,299 | 2,199,727 |
| HOUSEHOLDS, HOUSEHOLD TYPE BY HOUSEHOLD SIZE | ||||
| Family households: Map | 1,905 | 57,867 | 660,234 | 77,538,296 |
| 2-person household Map | 839 | 20,832 | 222,850 | 31,882,616 |
| 3-person household Map | 335 | 12,125 | 130,366 | 17,765,829 |
| 4-person household Map | 310 | 11,263 | 126,309 | 15,214,075 |
| 5-person household Map | 208 | 7,300 | 88,513 | 7,411,997 |
| 6-person household Map | 127 | 3,842 | 52,732 | 3,026,278 |
| 7-or-more-person household Map | 86 | 2,505 | 39,464 | 2,237,501 |
| Nonfamily households: Map | 425 | 20,881 | 217,458 | 39,177,996 |
| 1-person household Map | 345 | 16,867 | 164,018 | 31,204,909 |
| 2-person household Map | 68 | 3,017 | 34,119 | 6,360,012 |
| 3-person household Map | 5 | 567 | 9,684 | 992,156 |
| 4-person household Map | 5 | 307 | 6,145 | 411,171 |
| 5-person household Map | 1 | 77 | 1,688 | 126,634 |
| 6-person household Map | 1 | 35 | 1,457 | 48,421 |
| 7-or-more-person household Map | 0 | 11 | 347 | 34,693 |
| HOUSING UNITS | ||||
| Total Housing Units Map | 4,924 | 86,187 | 979,709 | 131,704,730 |
| HOUSING UNITS, OCCUPANCY STATUS | ||||
| Occupied Map | 2,330 | 78,748 | 877,692 | 116,716,292 |
| Vacant Map | 2,594 | 7,439 | 102,017 | 14,988,438 |
| HOUSING UNITS, OCCUPIED, TENURE | ||||
| Owned with a mortgage or a loan Map | 1,442 | 43,816 | 471,931 | 52,979,430 |
| Owned free and clear Map | 560 | 13,313 | 146,206 | 23,006,644 |
| Renter occupied Map | 328 | 21,619 | 259,555 | 40,730,218 |
| HOUSING UNITS, VACANT, VACANCY STATUS | ||||
| For rent Map | 42 | 1,809 | 20,176 | 4,137,567 |
| Rented, not occupied Map | 4 | 105 | 1,408 | 206,825 |
| For sale only Map | 80 | 1,294 | 14,580 | 1,896,796 |
| Sold, not occupied Map | 14 | 221 | 2,828 | 421,032 |
| For seasonal, recreational, or occasional use Map | 2,367 | 2,708 | 47,978 | 4,649,298 |
| For migrant workers Map | 0 | 2 | 232 | 24,161 |
| Other vacant Map | 87 | 1,300 | 14,815 | 3,652,759 |
| HOUSING UNITS, OCCUPIED, AVERAGE HOUSEHOLD SIZE BY TENURE | ||||
| Total: Map | 2.97 | 2.90 | 3.10 | 2.58 |
| Owner occupied Map | 2.96 | 2.99 | 3.21 | 2.65 |
| Renter occupied Map | 3.04 | 2.67 | 2.82 | 2.44 |
| HOUSING UNITS, OCCUPIED, TENURE BY RACE OF HOUSEHOLDER | ||||
| Owner occupied: Map | 2,002 | 57,129 | 618,137 | 75,986,074 |
| Householder who is White alone Map | 1,962 | 52,529 | 572,530 | 63,446,275 |
| Householder who is Black or African American alone Map | 2 | 478 | 2,896 | 6,261,464 |
| Householder who is American Indian and Alaska Native alone Map | 6 | 257 | 4,825 | 509,588 |
| Householder who is Asian alone Map | 8 | 710 | 10,203 | 2,688,861 |
| Householder who is Native Hawaiian and Other Pacific Islander alone Map | 2 | 88 | 2,469 | 61,911 |
| Householder who is Some Other Race alone Map | 8 | 2,347 | 18,506 | 1,975,817 |
| Householder who is Two or More Races Map | 14 | 720 | 6,708 | 1,042,158 |
| Renter occupied: Map | 328 | 21,619 | 259,555 | 40,730,218 |
| Householder who is White alone Map | 311 | 17,242 | 213,231 | 26,308,077 |
| Householder who is Black or African American alone Map | 0 | 612 | 5,356 | 7,868,519 |
| Householder who is American Indian and Alaska Native alone Map | 3 | 360 | 4,327 | 430,119 |
| Householder who is Asian alone Map | 2 | 249 | 6,271 | 1,943,303 |
| Householder who is Native Hawaiian and Other Pacific Islander alone Map | 1 | 64 | 2,784 | 82,021 |
| Householder who is Some Other Race alone Map | 4 | 2,443 | 20,995 | 2,940,610 |
| Householder who is Two or More Races Map | 7 | 649 | 6,591 | 1,157,569 |
| HOUSING UNITS, OCCUPIED, TENURE BY HISPANIC OR LATINO ORIGIN OF HOUSEHOLDER | ||||
| Owner occupied: Map | 2,002 | 57,129 | 618,137 | 75,986,074 |
| Not Hispanic or Latino householder Map | 1,971 | 52,009 | 575,835 | 69,617,625 |
| Hispanic or Latino householder Map | 31 | 5,120 | 42,302 | 6,368,449 |
| Renter occupied: Map | 328 | 21,619 | 259,555 | 40,730,218 |
| Not Hispanic or Latino householder Map | 316 | 17,139 | 218,060 | 33,637,301 |
| Hispanic or Latino householder Map | 12 | 4,480 | 41,495 | 7,092,917 |
| HOUSING UNITS, OCCUPIED, TENURE BY HOUSEHOLD SIZE | ||||
| Owner occupied: Map | 2,002 | 57,129 | 618,137 | 75,986,074 |
| 1-person household Map | 282 | 10,229 | 94,206 | 16,453,569 |
| 2-person household Map | 809 | 18,341 | 188,793 | 27,618,605 |
| 3-person household Map | 286 | 9,187 | 96,780 | 12,517,563 |
| 4-person household Map | 262 | 8,729 | 96,305 | 10,998,793 |
| 5-person household Map | 183 | 5,693 | 69,008 | 5,057,765 |
| 6-person household Map | 108 | 3,030 | 42,286 | 1,965,796 |
| 7-or-more-person household Map | 72 | 1,920 | 30,759 | 1,373,983 |
| Renter occupied: Map | 328 | 21,619 | 259,555 | 40,730,218 |
| 1-person household Map | 63 | 6,638 | 69,812 | 14,751,340 |
| 2-person household Map | 98 | 5,508 | 68,176 | 10,624,023 |
| 3-person household Map | 54 | 3,505 | 43,270 | 6,240,422 |
| 4-person household Map | 53 | 2,841 | 36,149 | 4,626,453 |
| 5-person household Map | 26 | 1,684 | 21,193 | 2,480,866 |
| 6-person household Map | 20 | 847 | 11,903 | 1,108,903 |
| 7-or-more-person household Map | 14 | 596 | 9,052 | 898,211 |
Loading...